Benchmarks
The Bismark Rust suite reimplements the Bismark
tools in Rust. Its output is byte-identical to Perl Bismark v0.25.1, so the two implementations can
be compared on runtime and memory alone.
This page covers a rough default-mode comparison with Perl, how the aligner scales with the number of cores it is given, and how the post-alignment tools that take a worker count scale with it.
Methods
Section titled “Methods”Measurements were taken on a single-tenant Linux x86_64 server (a 32-CPU allocation for the scaling
runs, 256 GB RAM). The Perl baseline is Bismark v0.25.1 run with LC_ALL=C. The same input was
given to both implementations, and outputs were compared after decompression
(cmp <(zcat a) <(zcat b)) to confirm byte-identity before timing. Wall-clock time, CPU
utilisation, and peak resident memory were recorded; the aligner runs use a process-tree memory
sampler (wrapper plus all bowtie2-align children), which over-counts memory-mapped index pages
shared between processes and so is an upper bound. The server is a shared node, so wall times carry
some load-dependent noise. Treat all figures as indicative rather than averaged.
A rough comparison in default mode
Section titled “A rough comparison in default mode”For orientation, not a claim that the Rust version is faster at everything; for several tools the goal was only byte-identical output, and timing is incidental.
| Tool | Rust vs Perl | Workload |
|---|---|---|
bismark aligner |
2.6× (directional) / 1.4× (non-directional) faster | 10M WGBS reads, byte-identical |
bismark extract |
~4.8× (matched cores) — up to ~46× vs Perl’s single-threaded default | full WGBS, 64.6M read pairs |
bismark cov2cyt |
~12× (CpG report) / ~2.6× (--CX) |
full hg38 |
bismark bedgraph |
~3.4× (CpG) / ~4.4× (--CX) |
WGBS PE |
bismark nome |
~3.4× | 10M SE |
bismark dedup, bismark bam2nuc, bismark filter, bismark consistency, bismark report, bismark summary, bismark prepare |
byte-identical; not separately timed | — |
Tools are shown by their canonical
bismark <subcommand>names; the classic names (deduplicate_bismark,bismark_methylation_extractor, …) remain supported aliases — see the quick reference.
Aligner
Section titled “Aligner”The aligner accounts for most of a run’s wall time. It calls the same external Bowtie 2 / HISAT2 / minimap2 binaries as the Perl version, so the mapping itself is unchanged, but Bismark also does a large amount of per-read work around the mapper — in-silico bisulfite conversion of every read and methylation-call tagging of every alignment. That wrapper is where the Rust port is faster.
On 10M reads (GRCh38, Bowtie 2 2.5.5, fixed 16-core budget), the faithful Rust aligner is byte-identical to Perl and:
| Mode | Perl wall | Rust wall | Speedup | Perl CPU | Rust CPU |
|---|---|---|---|---|---|
| Directional | 604 s | 229 s | 2.64× | 8601 core-s | 3145 core-s |
| Non-directional | 665 s | 477 s | 1.39× | 9408 core-s | 6910 core-s |
Scaling with cores
Section titled “Scaling with cores”The plots below show wall time, CPU and peak memory against the total number of cores given to the
aligner (instances × Bowtie 2 -p; the leftmost point of each curve is the single-threaded default
that a user gets with no threading flags). Bowtie 2 -p only parallelises alignment, not the
per-read wrapper work, which is why the two implementations behave differently as cores are added.
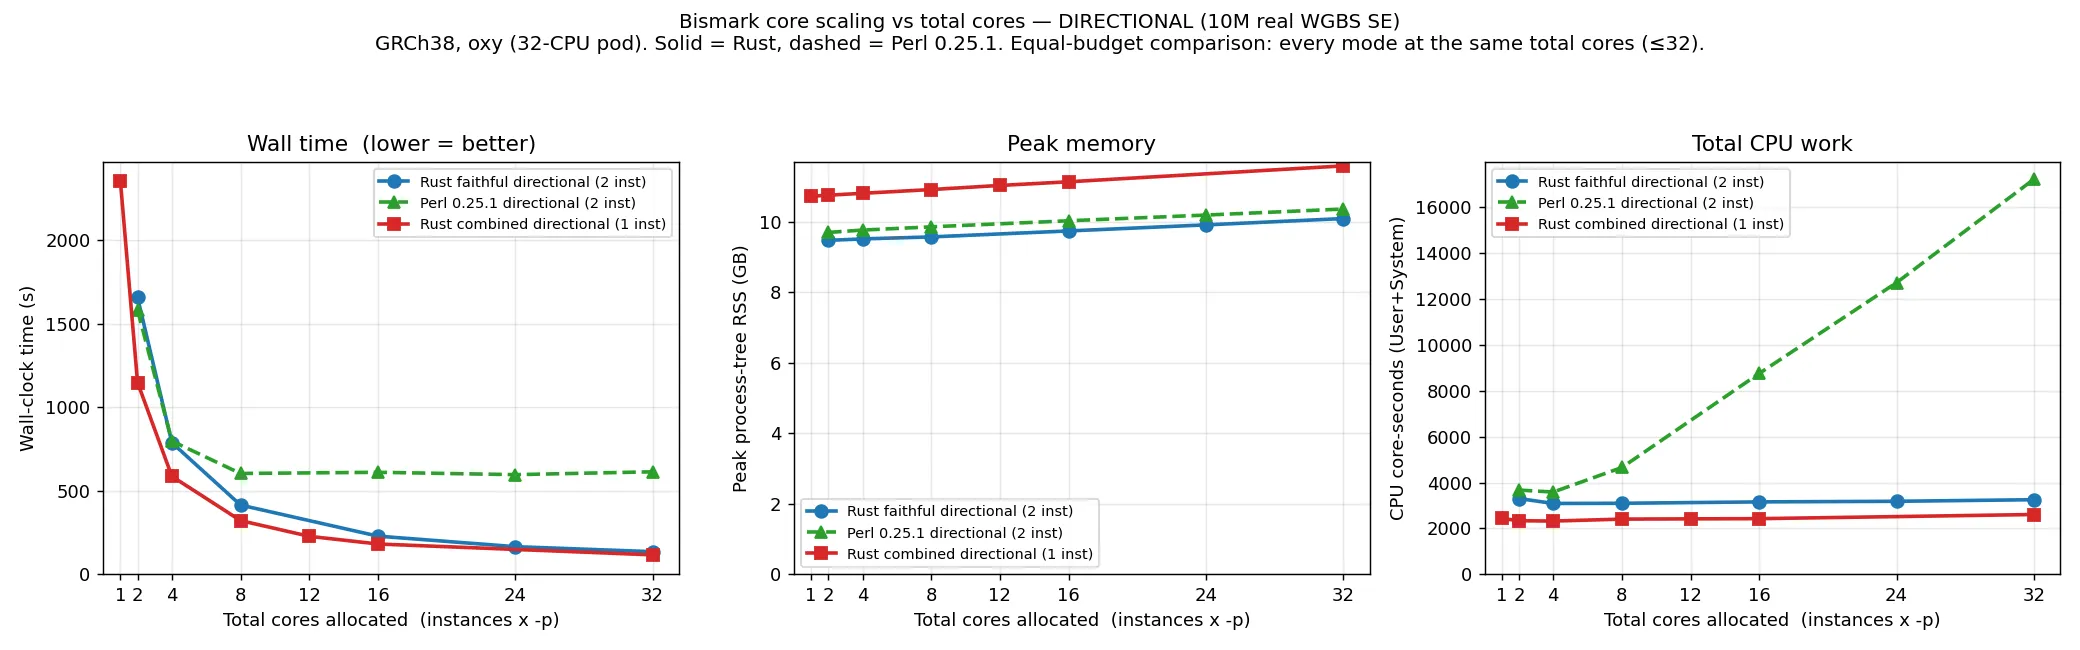
At one thread the two are comparable (both are alignment-bound: directional 1581 s Perl vs 1656 s
Rust). As cores are added the curves separate. At this 10M scale, Perl saturates at about 16 cores — wall
time stops falling while CPU cost keeps climbing (to roughly 17,000–18,000 core-seconds at 32 cores), because the
extra Bowtie 2 threads finish quickly and then wait on the serial Perl wrapper. The Rust wrapper is
cheap, so giving the aligner more cores continues to reduce wall time up to the full 32-core
allocation. At 32 cores the directional run is 613 s (Perl) versus 135 s (faithful Rust). In practice
this means -p (more cores) is a useful lever for the Rust aligner, whereas Perl needs --multicore
to use more than about 16 cores.
At full scale (single-end and paired-end)
Section titled “At full scale (single-end and paired-end)”The graphs above are a 10M subset with a directional/non-directional cut. The plots below instead show
single-end and paired-end directional alignment at full scale (real WGBS, GRCh38), Rust faithful
versus Perl v0.25.1, on the same total-cores axis.
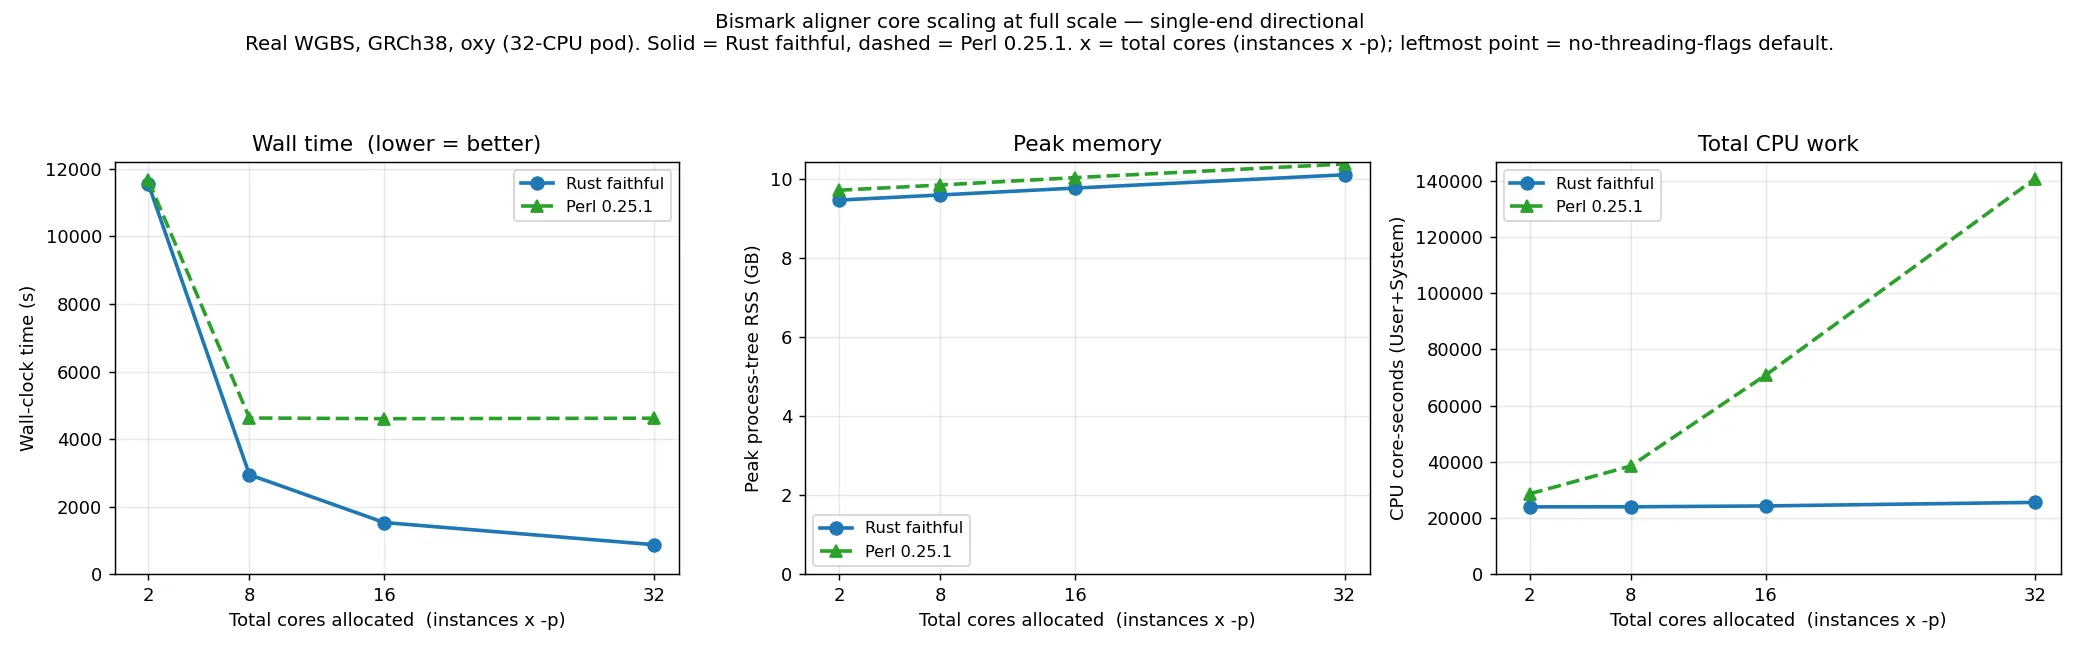
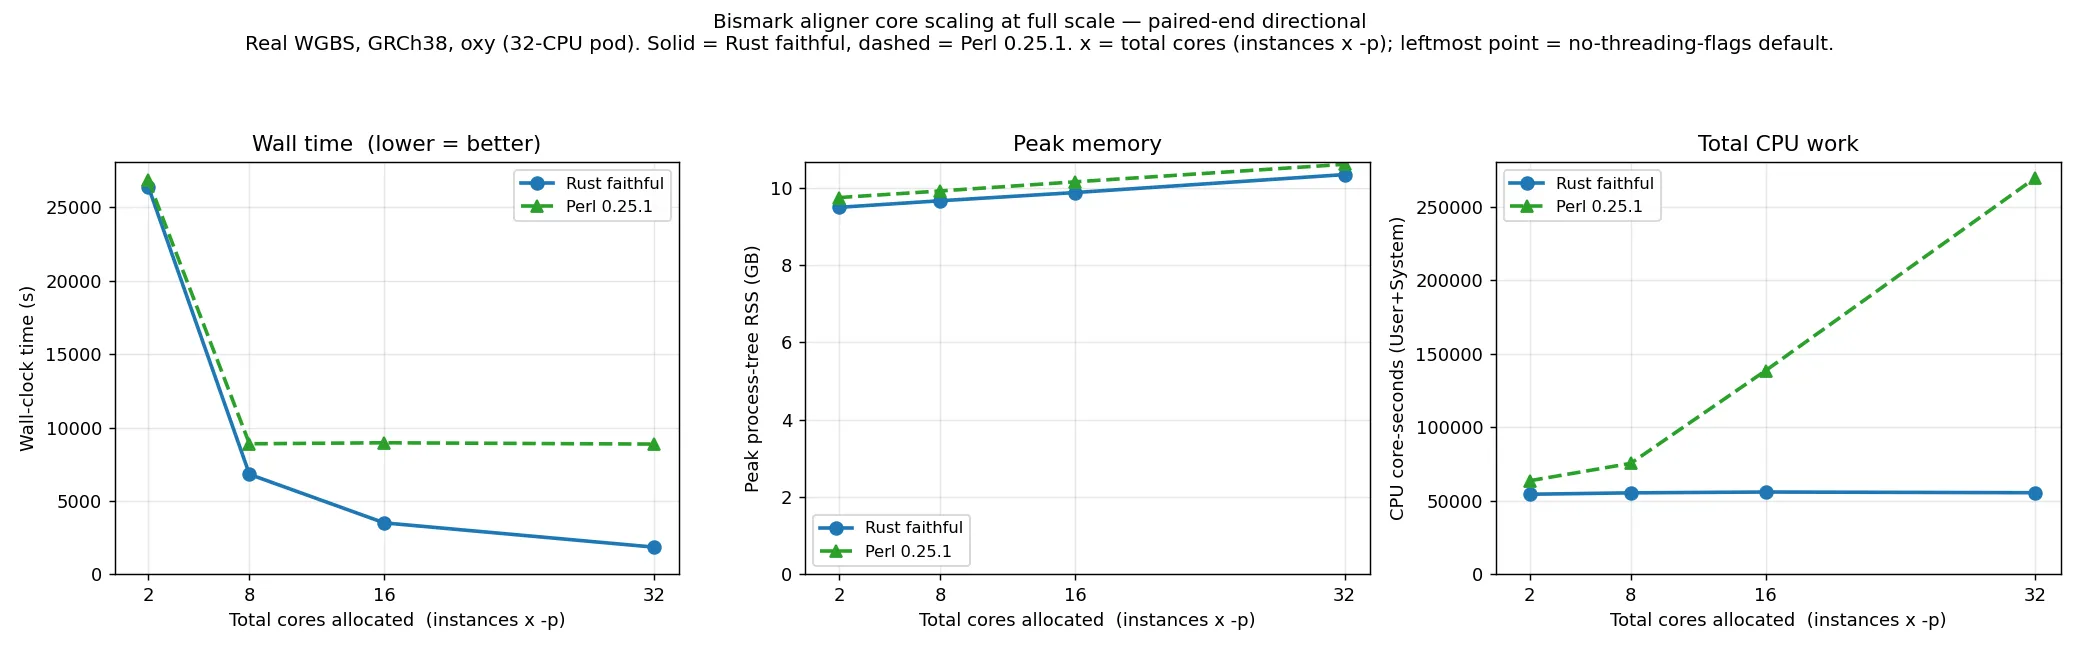
At the lowest budget (the no-threading-flags default) the two are within 1–2 %, both alignment-bound on the same Bowtie 2: single-end 11,556 s (Rust) versus 11,661 s (Perl), paired-end 26,408 s versus 26,834 s. As cores are added they diverge sharply. At full scale Perl saturates by about 8 cores — its wall time is flat (even slightly non-monotonic, from load noise) across 8, 16 and 32 cores — because the larger per-instance read count makes the serial Perl wrapper the binding constraint sooner than at 10M. The Rust wrapper stays cheap, so wall time keeps falling to the 32-core budget. At 32 cores the Rust aligner is 5.3× faster on single-end (874 s versus 4620 s) and 4.8× on paired-end (1847 s versus 8870 s), while using about 5× less total CPU (single-end 25,600 versus 140,700 core-seconds). Peak memory is about 10 GB throughout for both, set by the loaded index rather than the core count.
-p versus --multicore
Section titled “-p versus --multicore”The Rust aligner offers two ways to use more cores: -p (more Bowtie 2 threads per instance, sharing
one loaded index) and --multicore (split the input into N chunks aligned by N worker instances, each
loading its own index). At a fixed 16-core budget (10M WGBS single-end, directional), allocating those
cores entirely to -p is both the fastest and by far the lightest option:
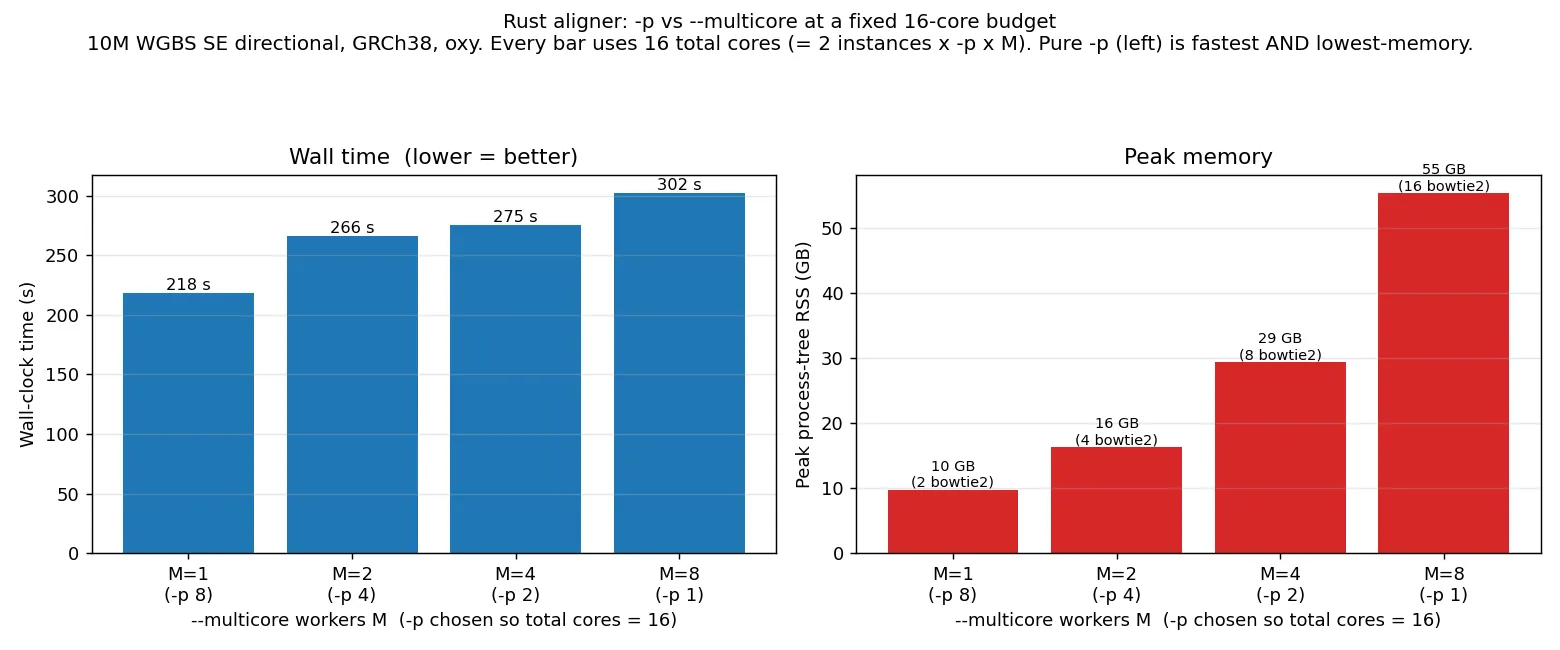
| Allocation (16 total cores) | Wall | Peak RSS | concurrent bowtie2-align |
|---|---|---|---|
-p 8 (pure -p) |
218 s | 9.8 GB | 2 |
--multicore 2 -p 4 |
266 s | 16.3 GB | 4 |
--multicore 4 -p 2 |
275 s | 29.4 GB | 8 |
--multicore 8 (pure --multicore) |
302 s | 55.4 GB | 16 |
Every step toward --multicore is slower and heavier: pure --multicore takes 38 % longer than pure
-p (302 s vs 218 s) and uses 5.7× the memory. The reason is the last column — --multicore N runs
2N concurrent bowtie2-align processes (2 per directional worker), each loading its own ~3.5 GB
index, so peak memory grows roughly linearly with the worker count, while -p keeps two index-sharing
processes and just adds threads (flat memory). This memory cost is independent of read count:
--multicore 4 peaks at ~29 GB on both the 10M subset and the full (~64M-read) data, because it is the
index copies, not the reads, that dominate. CPU core-seconds are flat (~3,000–3,300) across all
allocations.
Recommendation: prefer -p for the Rust aligner — it scales cleanly to the full core budget (see
the scaling graphs above) on a single shared index at flat memory. Reach for --multicore only once
-p is exhausted, and budget for roughly 2 × workers × index peak memory. (This is the opposite of
Perl, whose serial wrapper saturates -p by about 8 cores, making --multicore necessary there.)
The aligner links the mimalloc allocator. On Apple Silicon /
macOS that removes a system-allocator lock contention that made --multicore anti-scale badly; on the
Linux x86_64 benchmark host used here it is performance-neutral (glibc already uses per-thread
arenas), so the wall and memory figures above — and the -p recommendation — are the same with or
without it.
Combined-index modes
Section titled “Combined-index modes”The aligner also offers an opt-in combined-index mode that builds one index holding both the C→T and G→A genomes instead of separate per-strand instances. It is concordance-gated, not byte-identical: against the faithful result about 0.1 % of reads change fate, almost all unique↔ambiguous flips at cross-sub-genome ties, with actual mis-placement around 0.005 %. The numbers below are the 32-core envelope on the Linux benchmark host, median of repeats.
Directional — a clean win. One both-strands pass replaces the two per-strand instances, so it is faster at every core budget (10M and full scale) and uses about 22–28 % less CPU, for a fixed ~1.3 GB memory premium that does not grow with read count (it is the one larger combined index, not the reads). At full scale (real WGBS paired-end, 8-core budget) directional combined runs 5298 s versus 7373 s for the standard two-instance path (−28 %), at 43,200 versus 59,600 core-seconds.
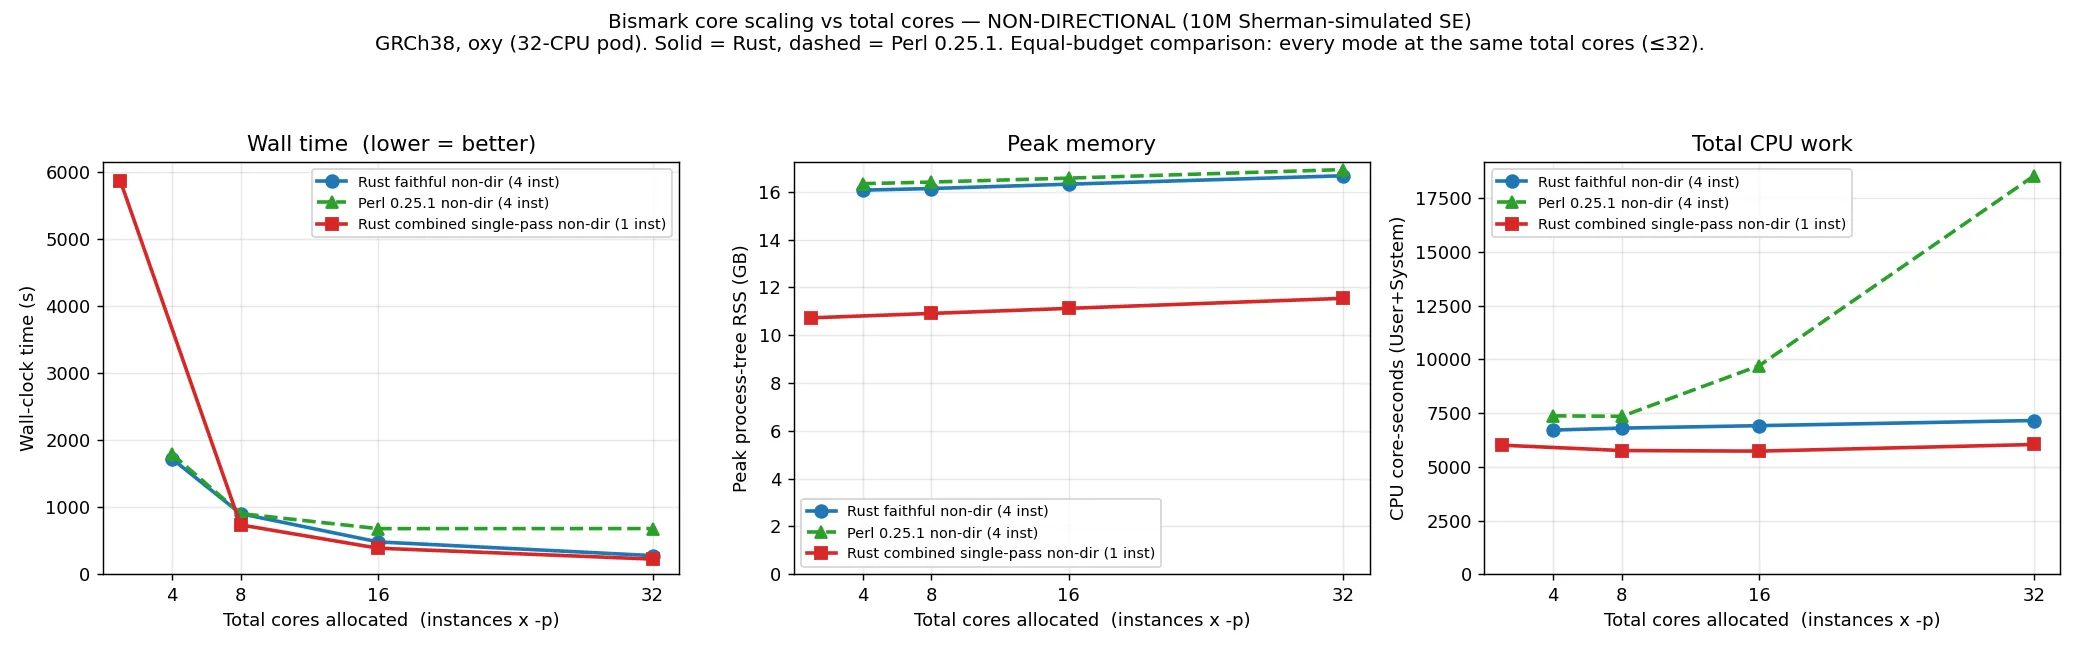
Non-directional — the sequential model is the default, and the pick. There are several concordance-gated execution models; measured at equal core budgets they rank cleanly:
| Non-directional, full-scale PE, 16-core budget | Wall | Peak RSS |
|---|---|---|
| standard (four per-strand instances) | 7810 s | 16.5 GB |
--combined_index_parallel (concurrent, opt-in; two passes at once) |
6114 s | 19.3 GB |
--combined_index_single_pass (one conversion-tagged pass) |
5371 s | 11.3 GB |
--combined_index non-dir default (sequential; two passes, one at a time) |
5043 s | 11.3 GB |
Running the two both-strands passes one at a time is the fastest and leanest non-directional
mode on this large mammalian genome, and is now the default for --combined_index --non_directional:
each pass gets the full core budget with a single ~11 GB index resident, which avoids the
memory-bandwidth contention of two concurrent passes (the opt-in --combined_index_parallel model keeps
two indexes co-resident at ~19 GB and is the slowest combined mode here). Its BAM is byte-identical to
the concurrent model (a), so it adds no correctness caveat beyond the combined index’s concordance-gating
(the *_report.txt marker and stderr banner name whichever model ran). On a small index with many
cores, where index-load rather than bandwidth dominates, the concurrent --combined_index_parallel model
can overlap the passes and be faster — the RAM win is unconditional, the wall win is for large genomes.
At full scale the sequential default even edges out the single-pass mode — which is faster than standard
but not decision-equivalent (it perturbs Bowtie 2’s read-name-seeded RNG, so about 1 read in 10,000
gets a different, equally-valid placement). The sequential default is the pick for non-directional data;
reach for --combined_index_single_pass only for its marginal extra speed at small scale, when the
non-decision-equivalence is acceptable.
The aligner’s --multicore / --parallel model is also worker-invariant: the output does not depend
on the number of workers.
Methylation extractor
Section titled “Methylation extractor”Perl’s methylation extractor is single-threaded by default. On 64.6M read pairs (WGBS, gzip output)
it takes 4583 s — about 76 minutes. The Rust extractor uses roughly 7 cores for parallel gzip
even at its default --parallel 1, and finishes the same job in about 99 s: ~46× faster out of
the box. Against Perl’s fastest parallel setting (--multicore 12, which drives ~19 cores) it is
about 4.8× faster at comparable resourcing.
| Run | Cores used | Wall |
|---|---|---|
Perl v0.25.1, default (single-threaded) |
~1 | 4583 s (~76 min) |
Perl v0.25.1, --multicore 12 |
~19 | 479 s |
Rust, default (--parallel 1) |
~7 | ~99 s |
So the speedup a user actually sees depends on how Perl was being run: dramatic against Perl’s single-threaded default, and a steadier ~4.8× against a heavily-multicored Perl.
Scaling with --parallel
Section titled “Scaling with --parallel”--parallel sweep in gzip-output mode, same WGBS data, three repetitions per point:
--parallel |
Wall (s) | CPU (cores) | Peak threads |
|---|---|---|---|
| 1 | ~99 | ~7.1 | 67 |
| 2 | ~101 | ~7.0 | 67 |
| 4 | ~100 | ~7.1 | 69 |
| 8 | ~98 | ~7.2 | 73 |
| 16 | ~95 | ~7.3 | 81 |
In gzip mode the extractor is limited by BAM decompression, which already keeps about 7 cores busy, so
raising --parallel barely changes wall time or CPU use; it mainly adds worker threads. Peak memory
stays well under 1 GB. (In uncompressed output mode the picture differs: CPU use is much lower and
memory grows with worker count.)
The same flat-with---parallel shape holds on single-end and RRBS data, and at full scale. The
single-end plot overlays a 10M subset with the full (~64M-read) run; the RRBS plot is a 10M subset.
Both overlay Perl, with wall time on a log axis to fit the range:
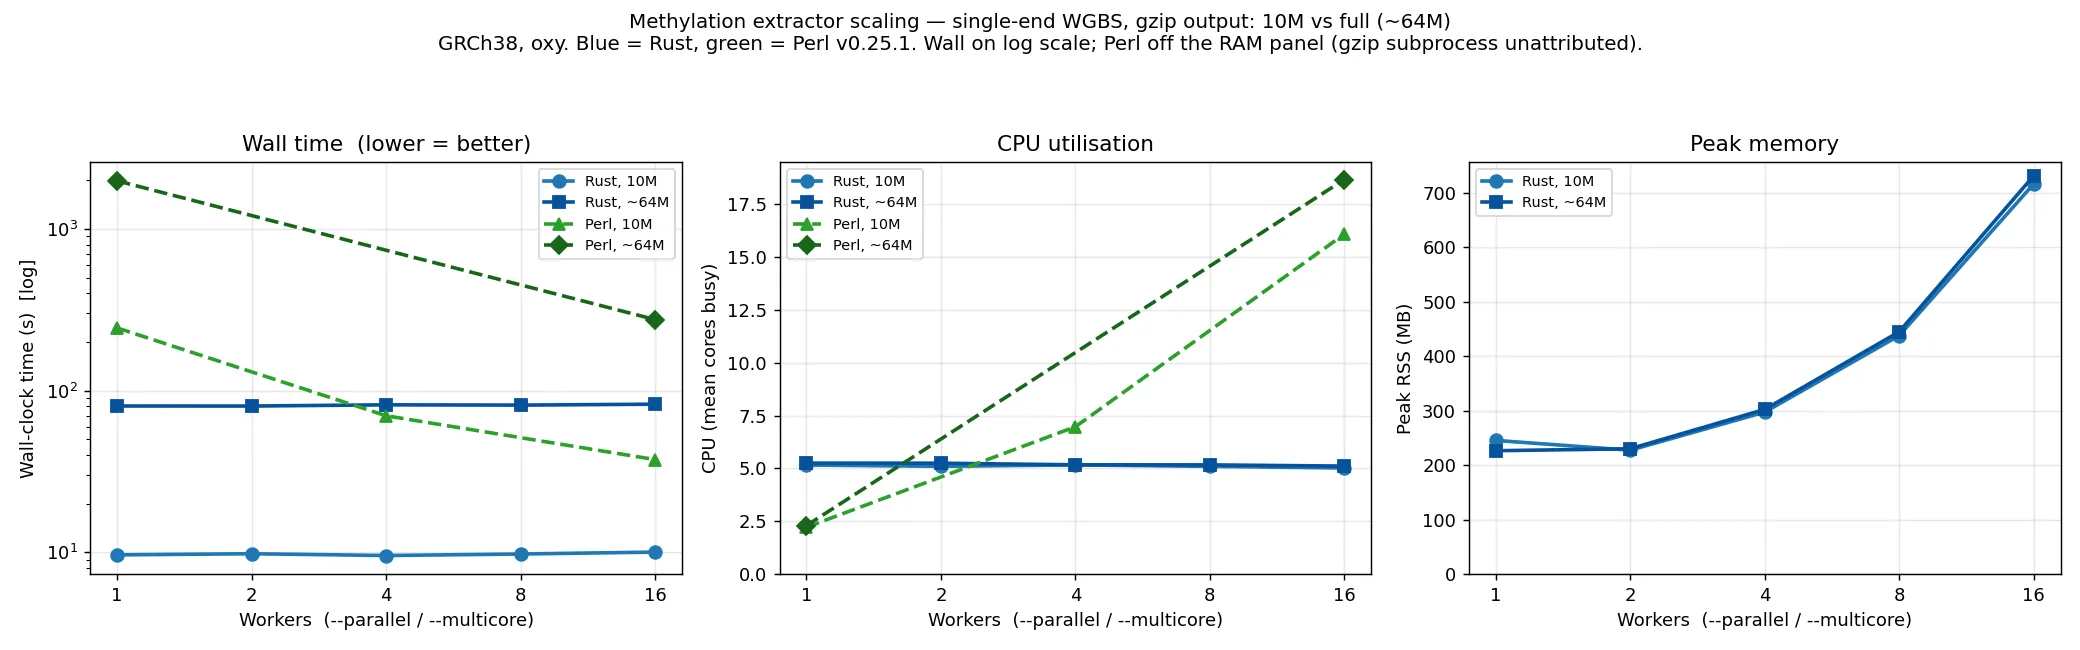
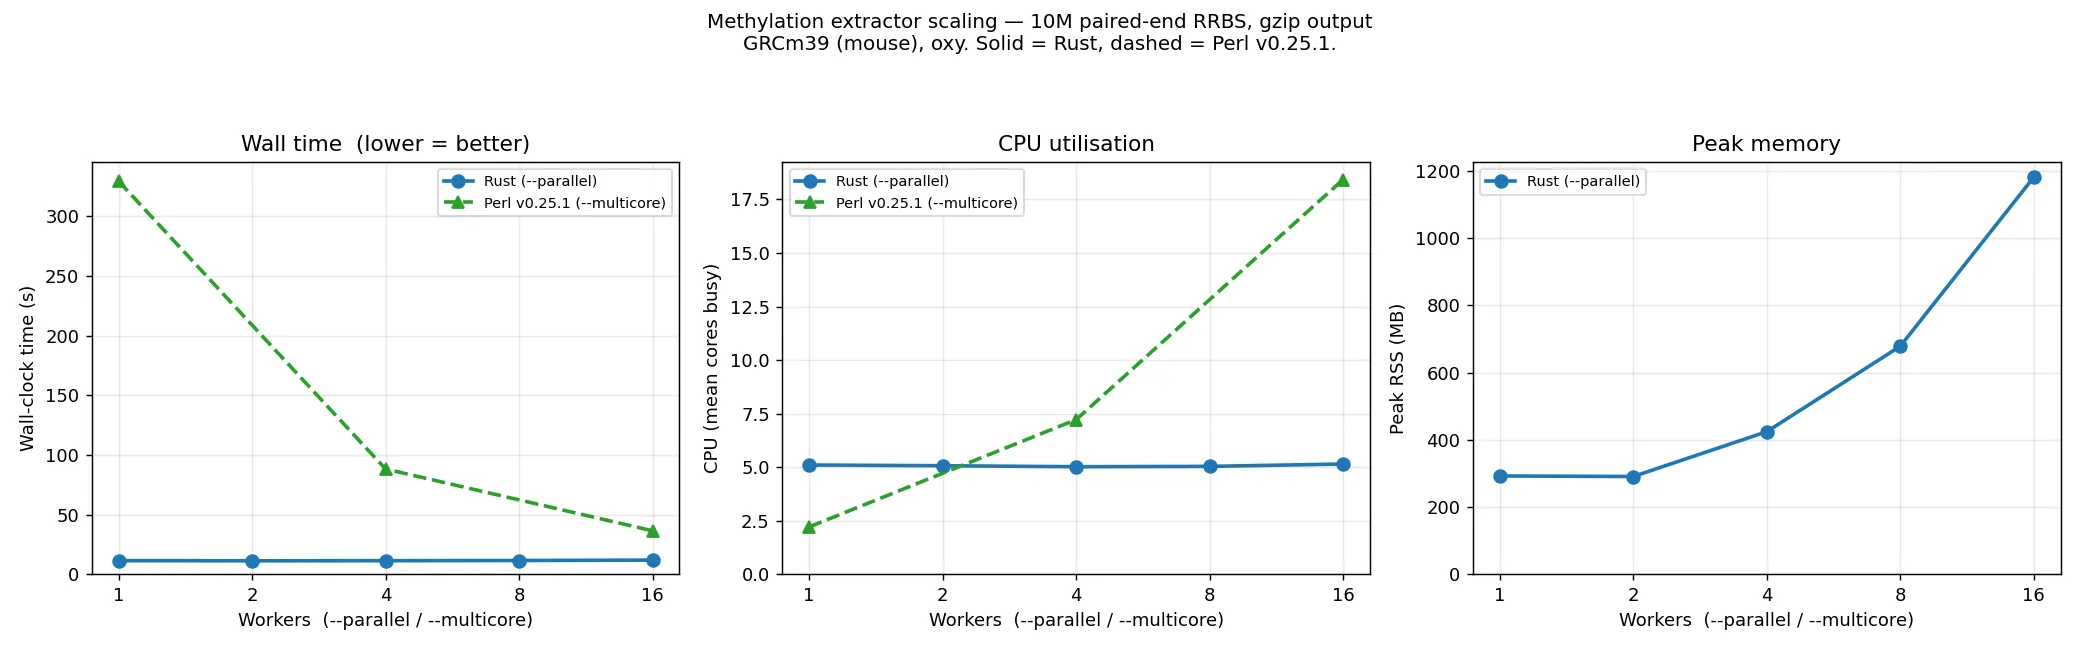
The Rust extractor holds wall time flat across --parallel at every scale (~10 s at 10M, ~80 s at
~64M single-end; ~11 s at 10M RRBS) on about 5 cores, and its peak memory is independent of read
count — the 10M and ~64M single-end curves coincide (~0.25→0.76 GB), because memory is bound by
per-worker output buffers, not the data. Perl is single-threaded by default: ~245 s at 10M and
~1980 s (~33 min) at ~64M single-end, only catching up by spending far more cores. So the Rust
default is ~25× faster than a single-threaded Perl run at both scales, and several times faster at
matched core counts. Perl is omitted from the memory panels (its gzip output goes through a separate
process the sampler does not attribute to it).
Deduplicator
Section titled “Deduplicator”bismark dedup --parallel N sets the number of BGZF compression threads for the output BAM. It
scales the same way at 10M and at full scale (~64M single-end):
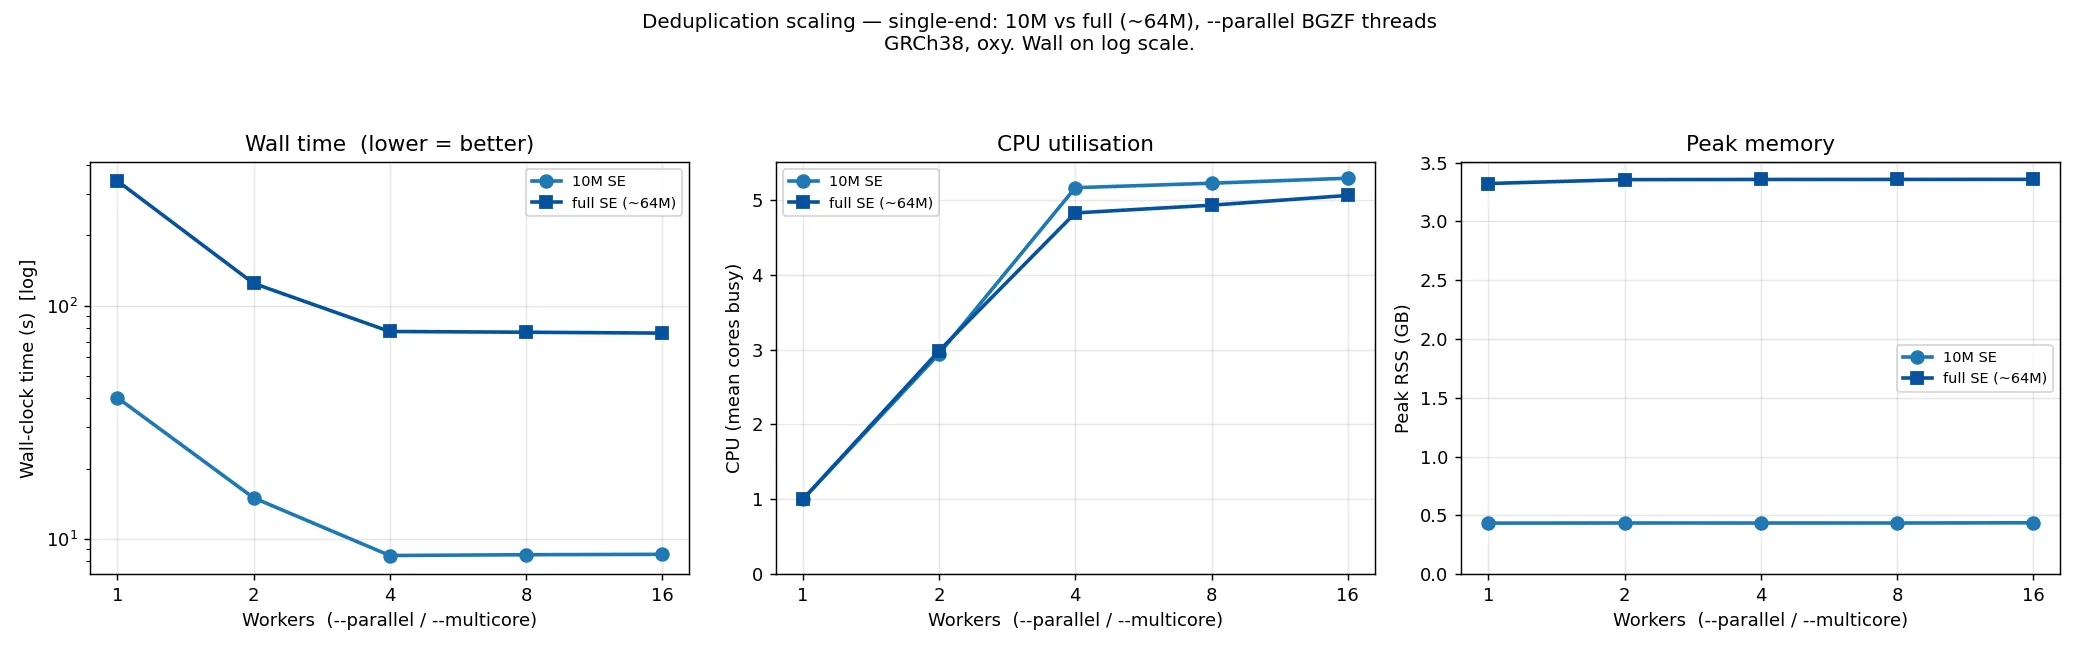
Wall time falls then flattens at ~4 workers at both sizes (10M: 40 → 8.4 s; ~64M: 343 → 77 s) — more than ~4 BGZF threads do not help, because the single-threaded deduplication logic becomes the limit. CPU use rises to about 5 cores. Peak memory is flat across workers but scales with read count (~0.45 GB at 10M, ~3.4 GB at ~64M), since deduplication holds read positions in memory.
rammap (experimental)
Section titled “rammap (experimental)”--rammap adds a fourth backend, rammap, a pure-Rust
reimplementation of minimap2 for long-read alignment (for example EM-seq Nanopore data). It is opt-in
and concordance-gated, and is not byte-identical to minimap2; it is a separate experimental track from
the faithful port.
On 1M EM-seq Nanopore reads (GRCh38, through the Bismark wrapper), rammap and minimap2 agree on the fate of 98.3 % of reads, with unique-versus-ambiguous classification differing for 0.011 % of reads, and on 99.8 % of per-CpG methylation calls at depth ≥ 1.
--rammap runs the in-process backend by default: the converted index is loaded once and shared
across the strand instances, which makes it both faster and lighter than spawning the external rammap
binary. Pass --rammap_subprocess to opt out to that external binary. On 1M non-directional reads:
| Metric | Subprocess (--rammap_subprocess) |
In-process (--rammap --multicore 16) |
|---|---|---|
| Wall time | 2451 s | 1382 s (~1.8× faster) |
| Peak memory | 70.9 GB | 32.3 GB (−54 %) |
The peak-memory win (−54 %) is independent of thread count — all threads share one in-memory index,
so it holds for any --multicore, including the default. The speed figure above is at --multicore 16; by default the alignment auto-threads to the available cores capped at 8 (a conservative
balance — pass a higher --multicore N for the full speedup, honoured verbatim), so the default is
faster and much lighter than the subprocess but does not reach the 16-thread peak. The in-process backend
is worker-invariant (identical output regardless of thread count). A --multicore sweep on a 50k-read
subset shows the shape:
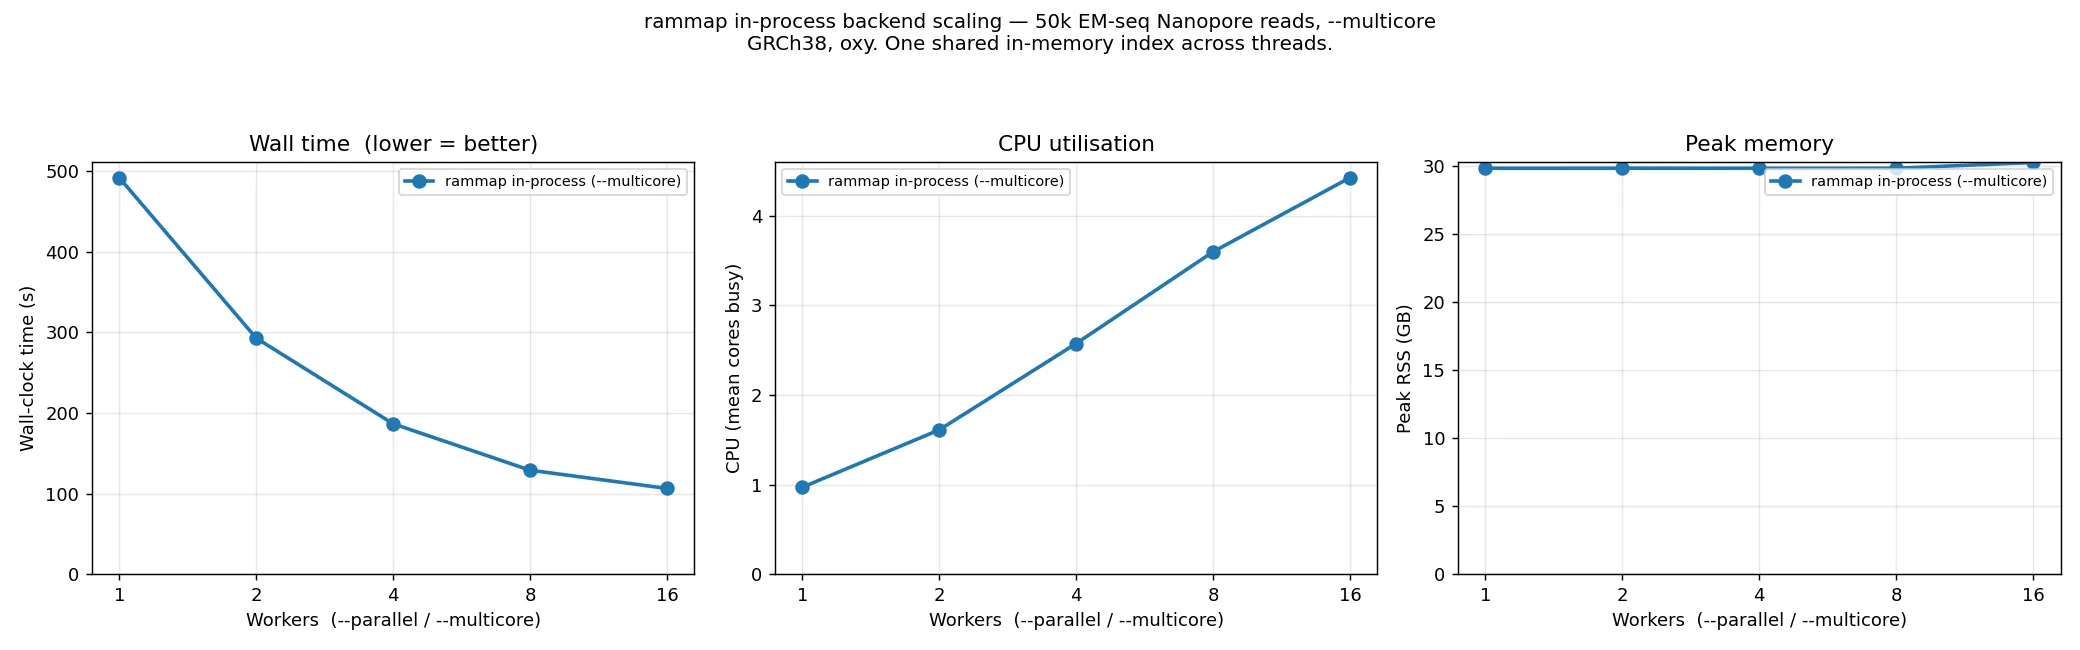
The index loads once (~80–90 s, single-threaded) and the per-read alignment then parallelises, so peak
memory is flat at ~30 GB across all thread counts. On this 50k sweep wall time falls 4.6× (~490 s →
~106 s, 1→16 threads); the one-off index load is a large share of the wall at 50k, so at the production
1M scale — where alignment dominates — the speedup over the single-threaded path is larger (~11×, the
figure behind the 1.8× win over the subprocess above). Running --rammap --multicore 1 forces the
single-threaded path; --rammap_subprocess runs the external binary.
Profiling the Perl pipeline
Section titled “Profiling the Perl pipeline”For context, the rewrite was prioritised from a profile of a complete Perl v0.25.1 run (Apple M1
Pro, 55.7M paired-end reads, GRCh38):
| Stage | Perl wall time | Share of total |
|---|---|---|
| Alignment (Bowtie 2) | 472 min | 74 % |
| Methylation extraction | 104 min | 16 % |
| bedGraph + coverage report | 57 min | 9 % |
| Deduplication | 8.7 min | 1 % |
Further work
Section titled “Further work”The parallel-capable post-alignment tools are now covered at both 10M and full (~64M) scale (above). A couple of measurements remain: a full-length aligner core-scaling sweep (single-end and paired-end directional), in progress; and rammap on paired-end data, which is single-end only at present.
The methodology and raw logs for the figures here are kept with each tool in the repository.